Use case #1 COVID-19 data
Properly versioned, daily updated COVID-19 data from multiple sources exported as JSON, consumable via a Python library and displayed in a rich UI.
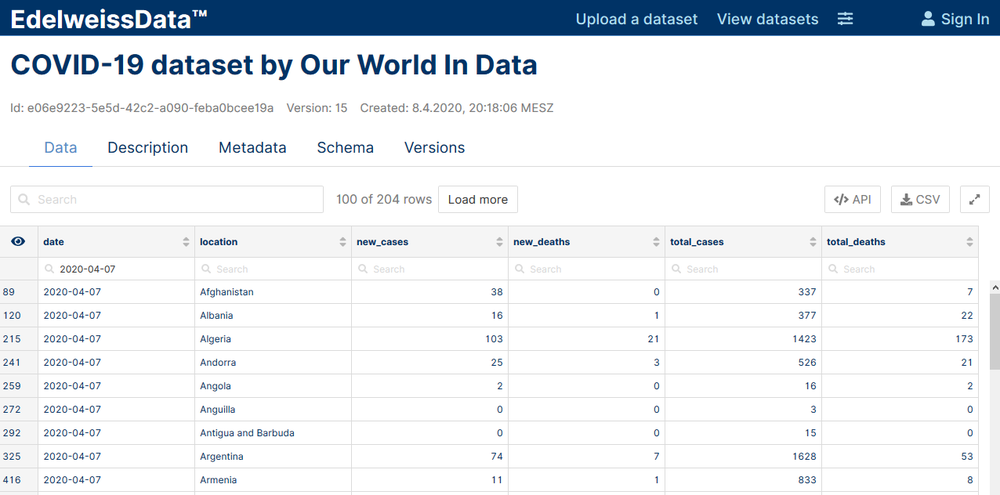
EdelweissData™ is a data management platform we built for managing scientific data of EU research projects. For our exploratory Covid-19 projects we used EdelweissData™ to help us with republishing and aggregating data from various sources in different formats. It allows us to deliver daily updates while always preserving previous versions for full reproducibility. All data is served as JSON which can be consumed easily by web applications that visualize it and create predictions. Complementing the REST API, our rich UIs enable users to dive into the underlying data to check and verify every data point.
The following data sources are available for non-commercial purposes in the form of REST APIs to the public:
- COVID-19 dataset by Our World In Data
- COVID-19 dataset by John Hopkins University
- COVID-19 state level data by the Robert Koch Institute
- COVID-19 US state level data by the New York Times
If you want to learn more, you can listen into the recorded webinar from 2 June 2020, where we gave a live demonstration of EdelweissData™ used for managing COVID-19 data: https://youtu.be/081Zhg1lkmM.
Use case 1
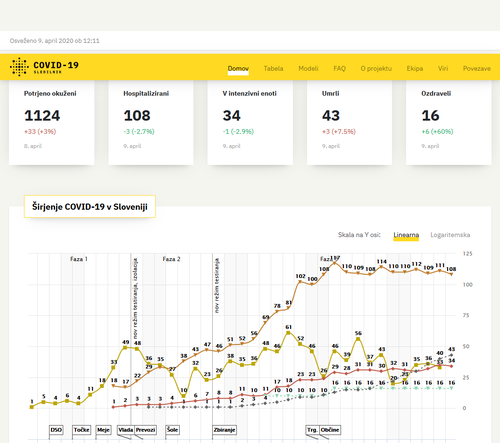
Slovenian data dashboard
Data for Slovenia was poorly presented in the early days of the SARS-COV-2 outbreak so we helped a team of volunteers to create a rich visualisation of the daily development of cases, deaths and hospitalisation counts. Pulling data into a web application as json made it easy to develop visualisations quickly.
In the beginning, a combination of google sheets and serving static CSV or JSON formatted data worked fine, but as the project progressed and the amount of data kept growing, using the EdelweissData™ API that can filter data interactively turned out to be really useful and allowed us to quickly add comparision for worldwide data.
Use case 2
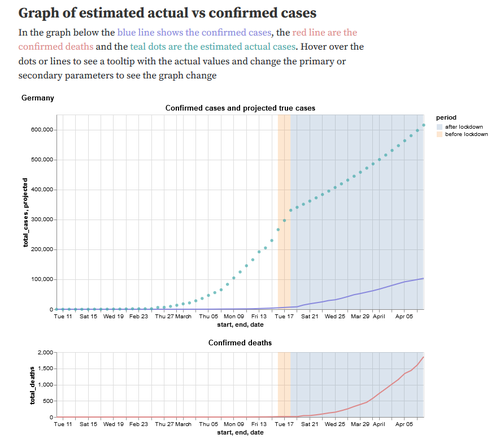
Estimating true infections from COVID-19 deaths
In this notebook we explored the idea of estimating the number of truly infected individuals in a population from confirmed COVID-19 deaths. Assuming that COVID-19 deaths should be discovered with a higher probability than (possibly asymptomatic or mild) cases, the notebook interactively estimates the number of truly infected.
The data is updated daily from several important data sources using Github Actions that run Python scripts using pandas for data restructuring and our EdelweissData™ python client for easy uploading of new versions. By treating every version as an immutable dataset it is always possible to go back in time and check predictions based on past data. The rich metadata support of EdelweissData™ came in handy to communicate things like the origin of every dataset, the date and time of data retrieval and links to more in-depth information.
Details of the workflow
We are always interested in adding additional datasets that might be useful for the public. What follows is a description of the process of preparing, publishing and consuming data via EdelweissData™ and a description of what you can do to add a dataset.
1. Ingesting the data
It all starts with the URL of the data you want to publish into EdelweissData™. Very often this will be a CSV file that is updated every day, but for some publishers it may also be just an html table with case numbers etc or an Excel file.
For ingesting data into EdelweissData™, you have two choices. Either you can use our comfortable UI called CSV-to-API to upload and annotate your data, or you can do it programmatically. The latter option has the nice benefit of being easy to automate so you can e.g. ingest data automatically every night.
Uploading using a UI
If you opt for using our CSV-to-API UI (login required) then you just click through the wizard to upload the dataset and annotate it. In the final screen you will see a link to go directly to the DataExplorer UI so you can take a look at your data.
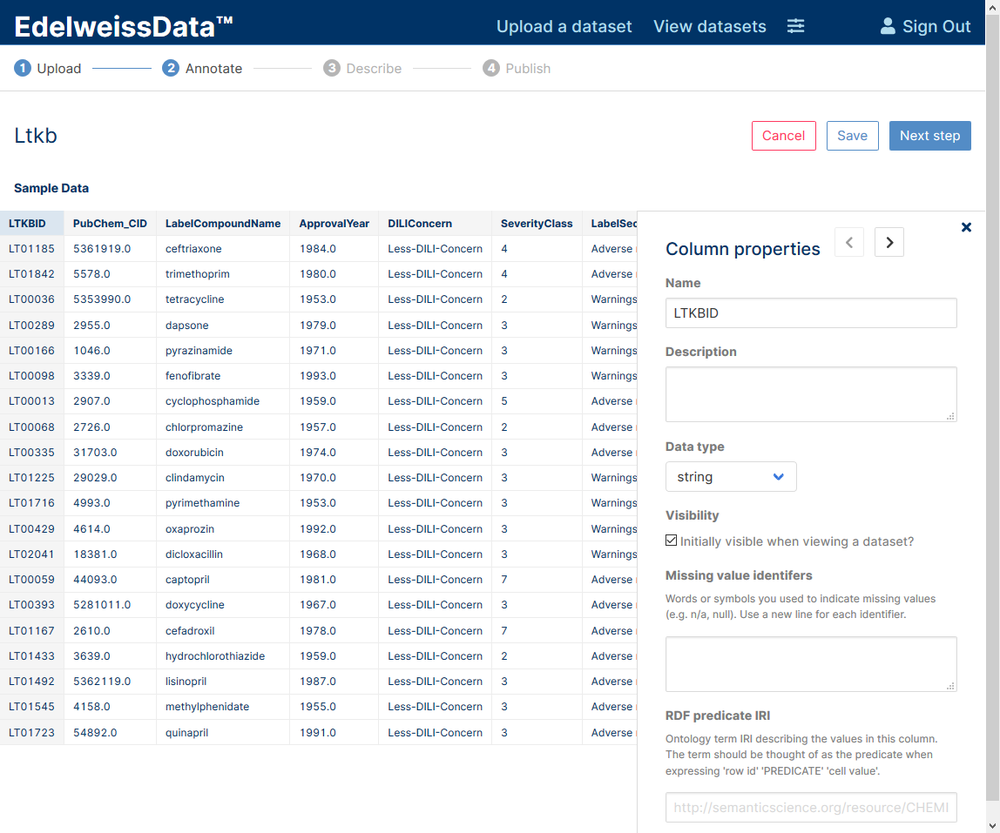
CSV-to-API wizard
Uploading via the API
If you opt for the programmatic way via the API then we want to set things up so that they can make use of Github Actions. Github Actions is a service provided by Github that is often used to compile software artifacts, but it can just as well be used to prepare data. Github actions can run a wide variety of scripting languages and what is not supported directly can be run inside docker containers.
In our examples we used Python with the popular Pandas library to download the original datasets and in some cases reformat the data (e.g. to go from a dataset that has cases in countries as rows and days as columns to a long form dataset where every row is one observation of cases for one date and one country). When developing these scripts we often work in Jupyter notebooks to iteratively check if the reshaping of the data works the way it is intended to work.
When we are happy with reshaping the data (or the data was already formatted well), the next step is to upload the data. For this we use our EdelweissData™ python library to upload the data together with a metadata in json form that describes the retrieval data and the upstream data provider as well as a description text that tells human consumers more about this dataset. The first time this is done a new dataset has to be created. For subsequent steps, instead of creating a new dataset we want to find an already published dataset (either by ID or by other criteria), and then publish a new version of this dataset - the code is almost identical in both cases.
Once the dataset is published for the first time you can see the result in the EdelweissData™ UI.
2. Automatically updating data
To trigger automatic publishing of updates, we then set up the Github Action itself. This is a yaml file that describes which actions to execute and how this is triggered (in our case a cron trigger that executes once a day at a specified time). The results of these actions can be seen in the Actions panel of the github repository page, but of course the scripts themselves can also notify their authors via email, Slack or other means about the status of the import process.
3. Viewing and consuming data
The first thing you will probably want to do after publishing a dataset is to check if the data does indeed look the way you think it should. For this, browse to the EdelweissData™ UI and click on your dataset to see its data in the DataExplorer. The interface is tabbed and next to the data tab you can also find the description (human readable text explaining the dataset) and the metadata (json encoded machine readable metadata).
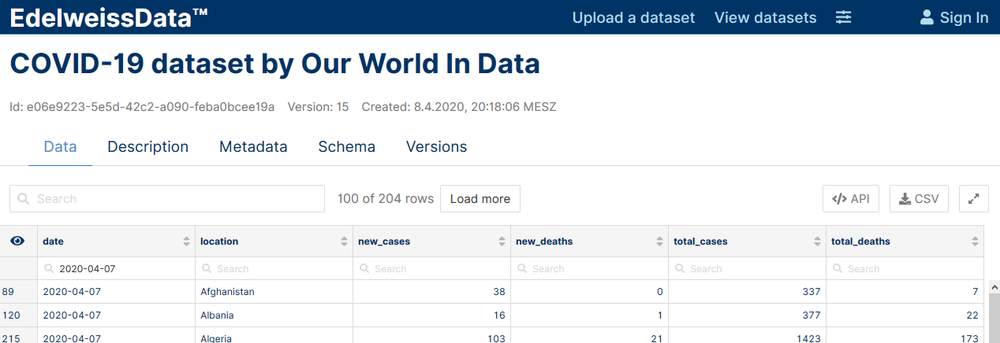
DataExplorer - a rich UI for exploring data and metadata
In the data tab you can filter data by entering search terms in the dataset search box or in one of the individual columns search box. On the top right you can find a button titled “API” that shows the code to download the data as currently filtered either via the Python library or via a curl command. The download button allows downloading a CSV of the currently filtered selection.